How TMC Insights Makes Troubleshooting Commands Easier
Not too long ago, a small team and I set out to build TMC Insights — a platform visibility product for the Transportation Mobility Cloud (TMC). We know that as platforms grow, so does the need for tools that provide greater visibility into the platform. We also know that more developers are using the TMC today than ever before, creating applications that leverage TMC’s near real-time bidirectional APIs. From here, it became clear that to successfully operate their businesses, our customers needed a way to view command and control metrics, specifically those related to command outcomes and timing.
By leveraging the TMC’s Command API, we were able to build a holistic command troubleshooting solution and offer it to our customers through TMC Insights, the Command API, and the TMC’s Management Console. Instead of consuming events from TMC’s Feed Service and building operational and analytics infrastructure to ingest and analyze those events, customers can use (and soon create!) dashboards in TMC Insights to monitor and investigate potentially problematic patterns identified in the aggregate data. So, how does it work?
Aggregate Command Data
The Core Remote Command Metrics dashboard available in TMC Insights (image below) enables our customers to monitor a subset of commands being sent through the TMC, specifically, the remote start, cancel remote start, lock, unlock, and refresh telemetry commands.
Each row in the dashboard provides the following metrics:
- The count of commands by command terminal state — success, cancelled, expired, or failure.
- The success rate relevant to that row’s command type(s).
- The end-to-end timing for that row’s command type(s) — or how long it took for a command to reach its terminal state after it was initiated on the TMC.
Note that the first row represents the aggregate data for all commands represented in the dashboard.
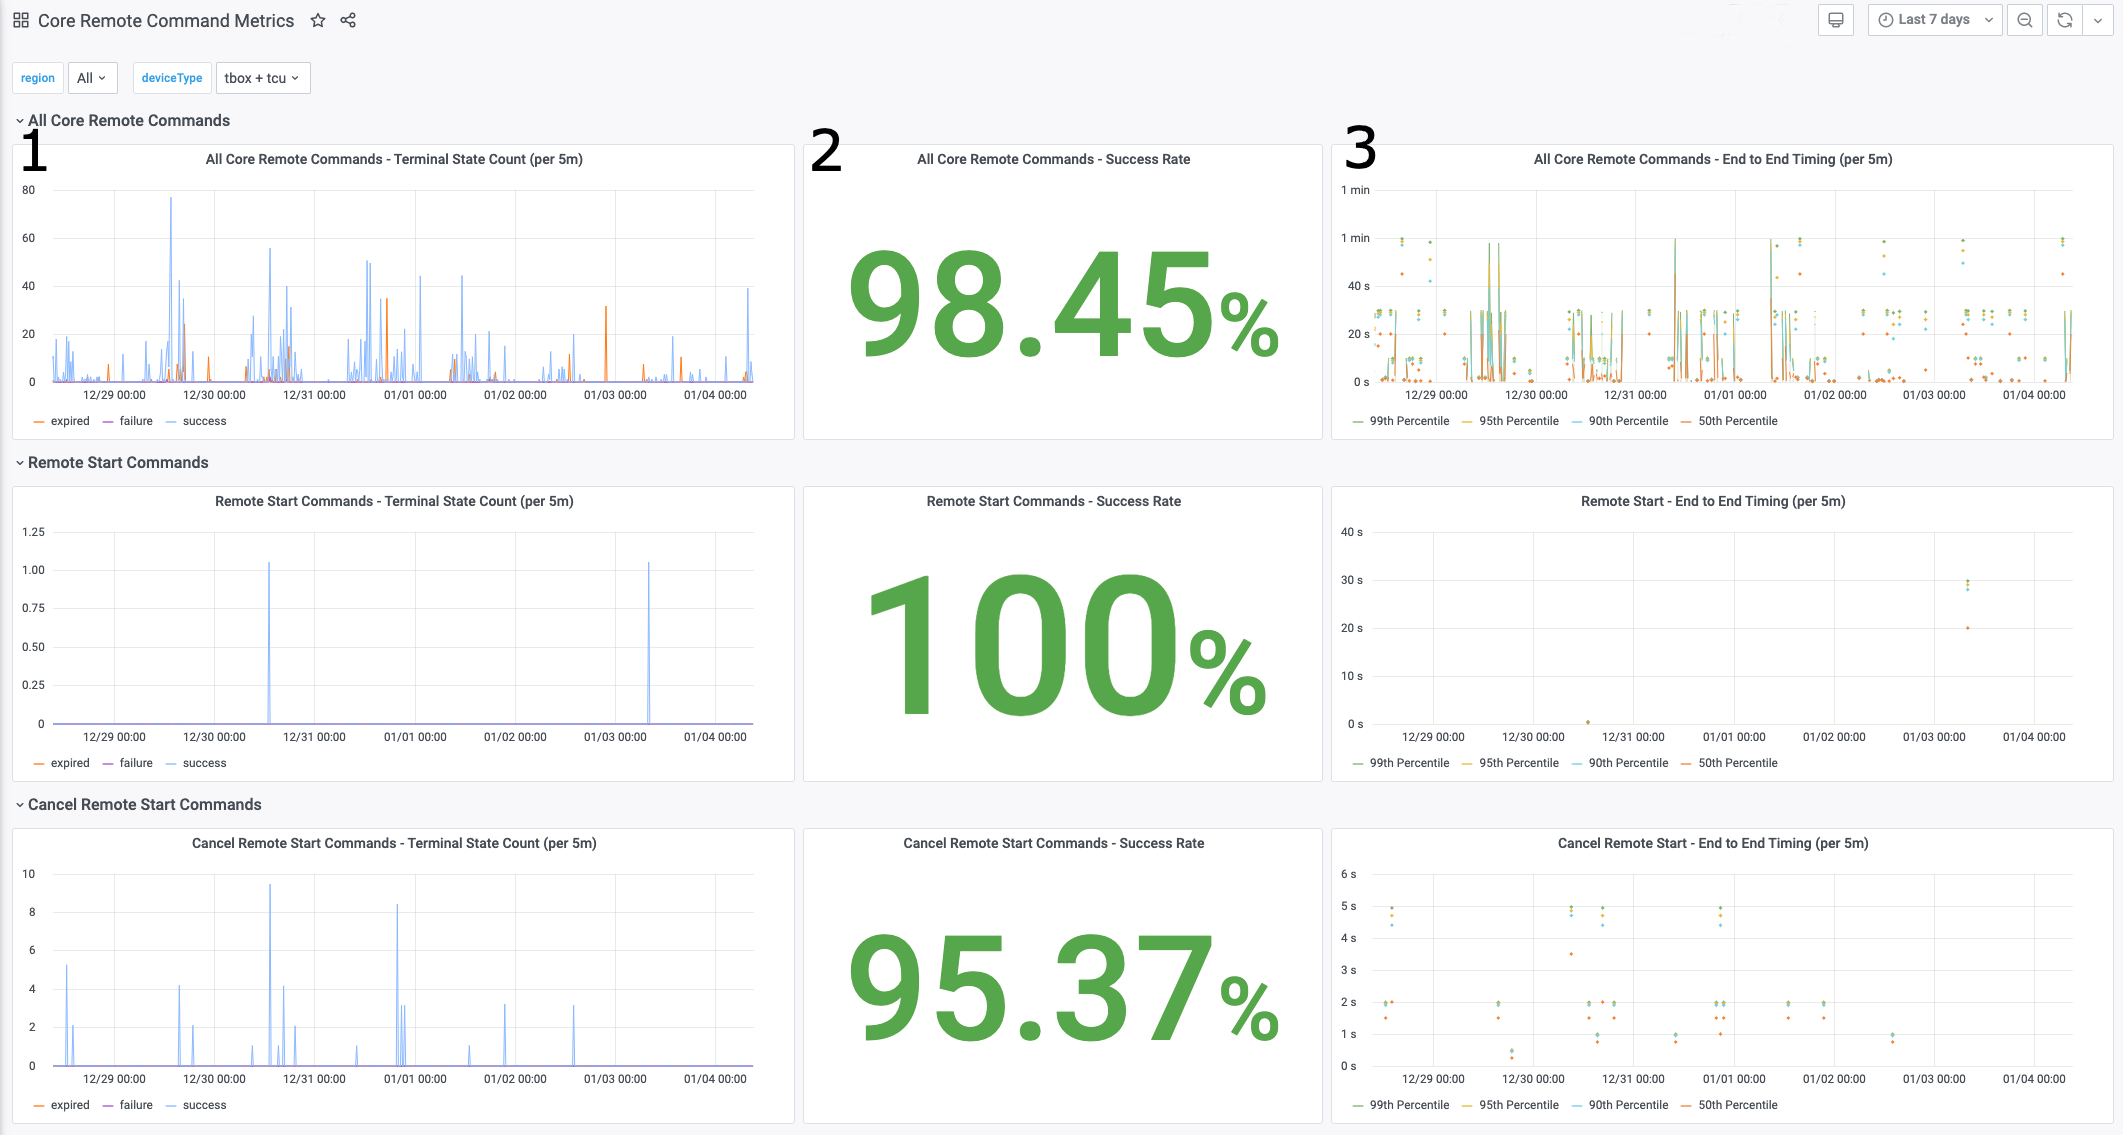
A sample view of the Core Remote Command Metrics dashboard available in TMC Insights.
Let’s imagine that you’re on a customer support team and you’re starting to notice an increase in issues related to expired remote starts. This could be due to many things — such as platform latency, a network outage, or even manufacturer limits on how often a driver can send a remote start to their vehicle. With a quick look at the Core Remote Command Metrics dashboard, you can see that, overall, remote start commands are being executed at an expected rate of 30 seconds or less. From here, you can conclude that platform latency is unlikely to be the root cause in this case and can move on to investigating other potential causes.
Spike in Failures
Not only can TMC Insights be used to diagnose known issues at a broader, symptomatic level, it can also be used to proactively investigate potential issues or narrow in on specific instances.
For example, a look at your dashboard might reveal a spike in failures for a specific command type, as in the image below. From here, you can easily determine the time, duration, and size of the failure to help narrow your investigation.
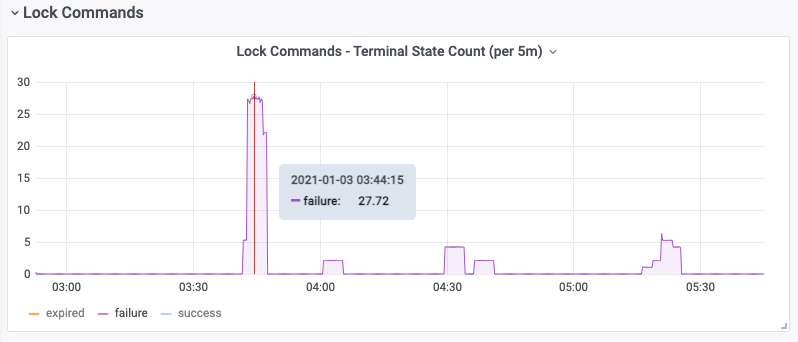
A view of the Lock Commands Terminal State Count dashboard.
To investigate the root cause of the failures in this scenario, you’d want to inspect failed lock commands for a specific time window using the Command API. To do this, you can issue a POST request to the Command API’s search endpoint with a request payload that includes the start and end timestamps associated with the metrics you observed in the dashboard as follows:
{
 "startTime": "2020-01-03T03:30:00Z",
 "endTime": "2020-01-03T04:00:00Z",
 "currentStatuses": [
 "FAILURE"
 ],
 "types": [
 "lock"
 ],
 "pageSize": 5
}
The response from the endpoint will provide a statusReason field with an indication of why the command(s) failed as shown below.
{
 "items": [
 {
 "id": ,
 "target": {
 "vehicleId": ,
 "deviceId":
 },
 "createTime": "2021-01-03T03:40:21.848922Z",
 "updateTime": "2021-01-03T03:42:22.145192Z",
 "statusReason": "Error sending message to vehicle.",  "currentStatus": "FAILURE",
 "region": "NA",
 "type": "lock"
 }
 ],
 ...
}
In this case, we see that the TMC was unsuccessful in sending the command to the vehicle. Together with Command API, TMC Insight’s dashboards can greatly improve how customers are able to monitor their business and reduce the time needed to identify or investigate issues.
What’s Next?
TMC Insights is in an early release stage and the Core Remote Command Metrics dashboard is an example of the opportunity and use cases we are working on. To provide even greater visibility into command tracking for our customers, we have several new features planned such as surfacing aggregate metrics for more specific status indicators, providing more granularity regarding a command’s timed journey, and creating complementary functionality within the TMC Management Console.